

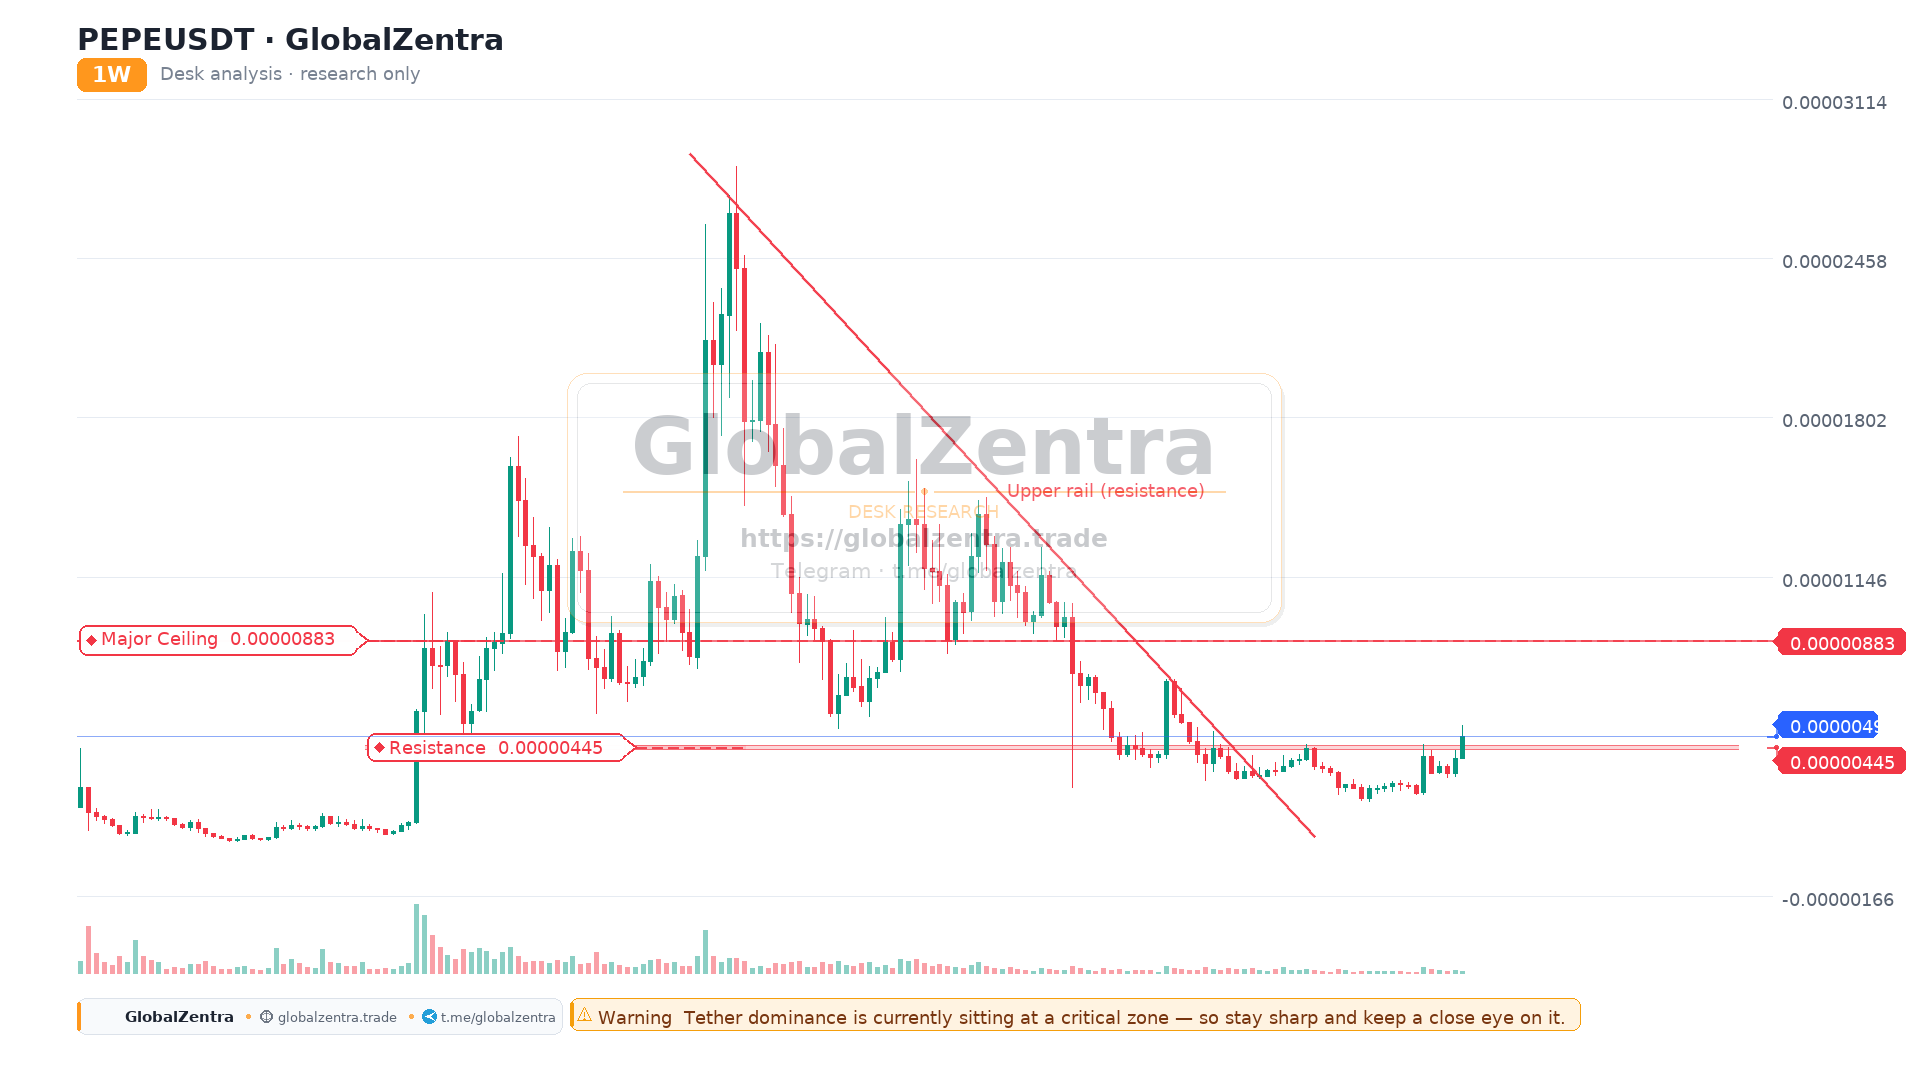
PEPE: Technical Analysis
PEPE is exhibiting a classic symmetrical triangle pattern on its weekly chart, indicating a period of consolidation before a potential significant move. This pattern is characterized by converging trendlines, in this case, a descending trendline acting as resistance at approximately $0.0052 and an ascending trendline forming support around $0.0022.
The price is currently compressing towards the apex of the triangle. A decisive weekly close above the $0.0052 resistance level would signal a bullish breakout, potentially initiating an upward trend. Conversely, a weekly close below the $0.0022 support level would suggest a bearish reversal.
Traders should monitor price action closely as we approach the potential breakout point. The direction of the breakout will likely determine the next major trend for PEPE.
- Resistance: $0.0052
- Support: $0.0022
- Upper Trendline: $0.0062 → $0.0052
- Lower Trendline: $0.0018 → $0.003
- Major Ceiling 0.0 — 0.00000879–0.00000883
Desk notes
- ⚠ Warning — Tether dominance is currently sitting at a critical zone — so stay sharp and keep a close eye on it.
Market chart
Chart
Key levels
- Major Ceiling — 0.00000879–0.00000886
- Resistance — 0.00000438–0.00000452